Tools & Interactives

This video of data from February 2014 shows storm clouds, then an animation of moisture from the tropics, and finally, how the atmospheric river banked up against the storm's cold front and moved inland with it.
View this tool
This image shows the total precipitable water forecast on April 6, 2018. The narrow bridge of moisture connecting the tropics and the U.S. West Coast is known as an atmospheric river.
View this tool
Long-term sea level change trends at 100+ U.S. locations. Blue, upward arrows show where local sea level is rising. Brown, downward arrows show where local sea level is falling.
View this tool
Over 100 climate and environmental variables from NOAA's vast archive presented in a map-based interface that allows you to see, query, capture, share, and download data.
View this tool
Up to date, easy to download climate maps suitable for re-use in news articles, blogs, presentations, reports, or any place a polished product is required.
View this tool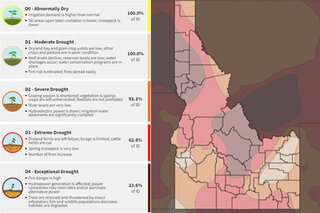
Interactive table and map showing state- and county-specific drought impacts ranked by U.S. Drought Monitor categories, including impacts to industry, natural resources, and human health.
View this tool
Interactive map of the hottest maximum temperatures at locations and when that record was set, recorded at thousands of U.S. stations.
View this tool
Compare the Anza-Borrego Desert basin before and after abundant winter rains. The park is all bare ground in early fall, but following the rains, green coats the canyon floors and the surrounding hillsides.
View this tool